Browser calculation and numerical validation of silicon response and electron–phonon coupling
Finite-displacement density response, Γ phonons and ultrasoft-pseudopotential electron–phonon coupling in fixed-cell silicon: native/browser comparisons, finite-k/q sampling errors and figure reproduction.
Felix Fei
2026-10-14 · Mol2Mat · revision 2
Finite displacements are used to evaluate density response, Γ-point phonons and ultrasoft-pseudopotential electron–phonon coupling in silicon at fixed cell. A browser plane-wave DFT implementation is compared with matched native calculations and direct responses to assess numerical agreement and four-valence-band Wannier interpolation. The Γ optical frequency is 15.40217 THz; at the sampled off-grid point, the coarse-mesh transverse-acoustic frequency differs by 21.73 %. Discretization, finite-difference and -sampling errors are reported separately, with data for figure reproduction. Ground-state calculations are described in browser-local DFT.
Electronic density response and Γ phonons
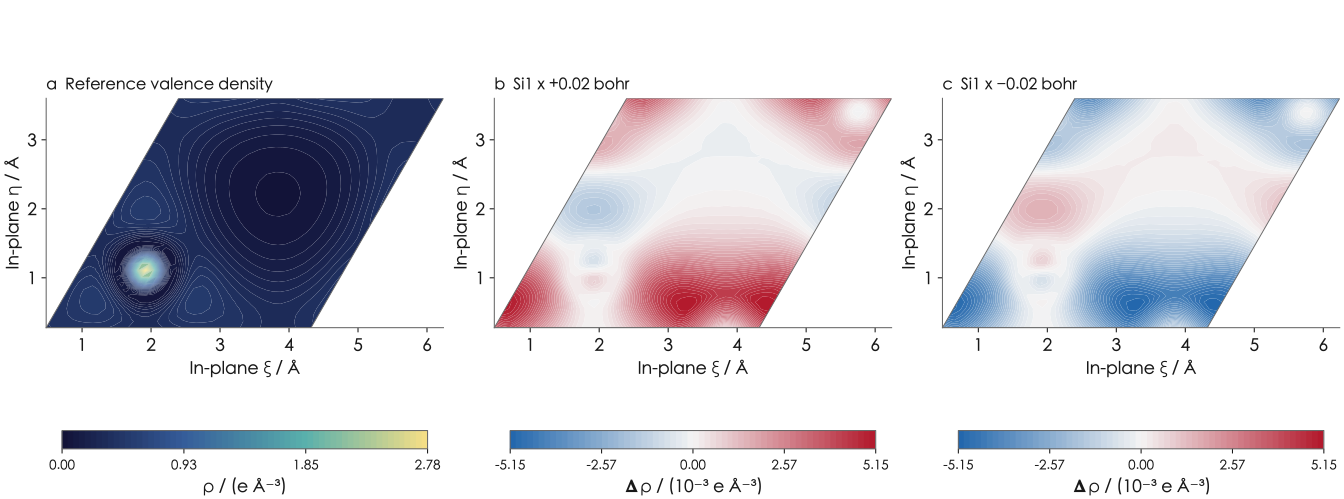
The reference is diamond silicon at fixed cell: the two-atom primitive cell corresponds to a conventional cubic lattice parameter of 5.42936 Å. The calculation uses PBE/GBRV ultrasoft pseudopotentials (USPP), 20/100 Ha wavefunction/density cutoffs, a Γ-centered 12³ electronic integration mesh and a 36³ density grid. The valence density integrates to 8 electrons. Figure 1 shows bonding density and displacement-induced changes in this pseudopotential valence distribution.
Displacing sublattice along by gives density derivatives and force constants from the two self-consistent states:
A primitive-cell displacement moves all periodic images of that sublattice. It describes a response, with force constants summed over intercell interactions. The signed density differences in Figure 1 show redistribution; the centered difference estimates the first derivative from the odd-in-displacement component, with second-order step-size truncation error for a smooth response.
Reducing the displacement from 0.02 to 0.01 bohr changes the browser force-constant columns by 0.01049 % and the density derivative by 0.11281 % in relative L² norm. These differences quantify step-size sensitivity for the two response quantities.
Figure 1b shows a local difference-density slice around Si1. The gold atom identifies the periodic sublattice under examination; blue and orange indicate depletion and accumulation relative to the reference. Positive and negative displacements are compared at the same slice position and color scale. The local crop highlights redistribution near bonds; its boundary limits the viewing region only, while the calculation retains the periodic primitive cell.
Symmetry and density-grid aliasing
Energy curvatures and force derivatives exhibit a discretization discrepancy that persists under tighter SCF thresholds. The ideal structure has 48 space-group operations, while displaced states have lower symmetry; a common-subgroup comparison reduces the discrepancy. Reciprocal-space inspection locates aliasing on the nonorthogonal primitive-cell grid: USPP augmentation and partial-core radial fields contain FFT-corner components beyond the density-cutoff sphere, and periodic wrapping after symmetry rotations changes their physical vectors.
For example, rotation and wrapping map index to , changing from 276.02145 to 654.05082 bohr⁻²; the 100 Ha density sphere requires bohr⁻². The repair applies a symmetry-independent spherical bandlimit projection to augmentation and partial-core fields, with the corresponding adjoint projection in electronic and atomic derivatives. This preserves , electron count and automatic space-group handling while removing the contribution of out-of-sphere corners to symmetrization.
After spherical projection, the automatic-group/common-group energy difference for the same native reference structure decreases from 1.06787×10⁻⁶ to 1.86517×10⁻¹⁴ Ha. Full- and half-step energy/force curvature discrepancies are 0.01360 % and 0.01786 %, respectively, showing residual discretization error after the symmetry correction. Their step-size dependence is consistent with a contribution from grid quadrature error.
From force constants to Γ modes and synchronous electronic response
Mass weighting converts force constants to the dynamical matrix:
With natural-average silicon mass 28.085 u, the result has three translation zero modes and a triply degenerate optical mode at 15.40217 THz (513.76109 cm⁻¹). Three force columns are direct centered differences and three are generated by space-group relations, so the degeneracy partly reflects imposed symmetry. The acoustic-sum-rule (ASR) correction changes the matrix by a relative 2.45×10⁻⁹ without altering the optical frequency at output precision.
Combining density derivatives with maximum per-atom displacement and display pattern gives
The two sublattices move in opposite directions in the optical mode, and the induced density shares the displacement phase. A phase shift of π exchanges accumulation and depletion; the first-order density response vanishes at zero displacement. This spatial response is assembled from six Cartesian density derivatives and describes adiabatic electronic redistribution.
Dynamical-matrix eigenvalues are squared angular frequencies . Values in THz denote ordinary frequency , and wavenumbers use . Zero-point displacements and coupling normalization use angular frequency .
Ultrasoft-pseudopotential electron–phonon coupling
Displacement derivatives of the USPP electronic operator
Electron–phonon coupling is a derivative of the electronic operator with respect to atomic displacement. Self-consistent density includes screening, and the displaced-state operators must then be projected in a common electronic reference space. An eight-band fixed-density solve at electronic on the 12³ reference density supplies the three degenerate valence states in coefficient matrix . remains fixed across displaced states. Each signed perturbation is self-consistent; the fixed-density solve defines only the reference electronic states.
USPP obeys the generalized eigenproblem [2]. contains the local potential, nonlocal projectors and self-consistent-potential-dependent augmentation; is a nontrivial overlap operator. The complete projections are
Displacement changes both and . Reorthogonalizing in the perturbed overlap would change the electronic basis being compared. Fixed-reference projection keeps these contributions in a common subspace for differentiation.
For the Γ degenerate triplet with aligned reference energy , the first-order effective operator is
The second term is the USPP overlap correction. The reference triplet has a spread of 2.14×10⁻¹⁴ Ha and a gap of about 0.09434 Ha to the nearest external state, supporting treatment of its splitting in a local complex 3×3 subspace. General finite- transport has a two-sided structure, discussed below.
Potential gauge and mode normalization
A constant potential shift enters USPP as , so gauge alignment uses . JDFTx’s Vscloc output includes a volume-element factor: its physical cell mean is sum(Vscloc)/detR, whereas directly averaging grid entries introduces an extra . Reprocessing the same / matrices with the physical mean changes the Γ coupling matrix by a relative 2.20×10⁻⁸. The gauge effect is thus separately quantified and, here, much smaller than finite- sampling error.
The mode vertex uses normalized polarization vectors and zero-point displacement factors [3]:
is the screened operator derivative with primitive-cell Bloch normalization. The Γ optical-x display pattern is (−1,0,0,+1,0,0), giving a per-atom zero-point displacement Å and . A single phonon in macroscopic N cells carries an additional ; the vertex here is defined per primitive cell.
Γ coupling spectrum and valence splitting
The Γ optical-x mode gives three coupling eigenvalues of −234.755061, approximately zero and +234.755063 meV within the valence triplet, with =110219.878143 meV². The level slopes per atomic optical amplitude are about −9.712914, zero and +9.712914 eV Å⁻¹. Figure 3 places this eigenchannel spectrum alongside centered energies from displaced states: the former describes the linear perturbation, the latter tests its finite-amplitude prediction. Unitary rotations within the electronic subspace preserve the spectrum and total intensity, making these quantities useful representations of degenerate-state coupling.
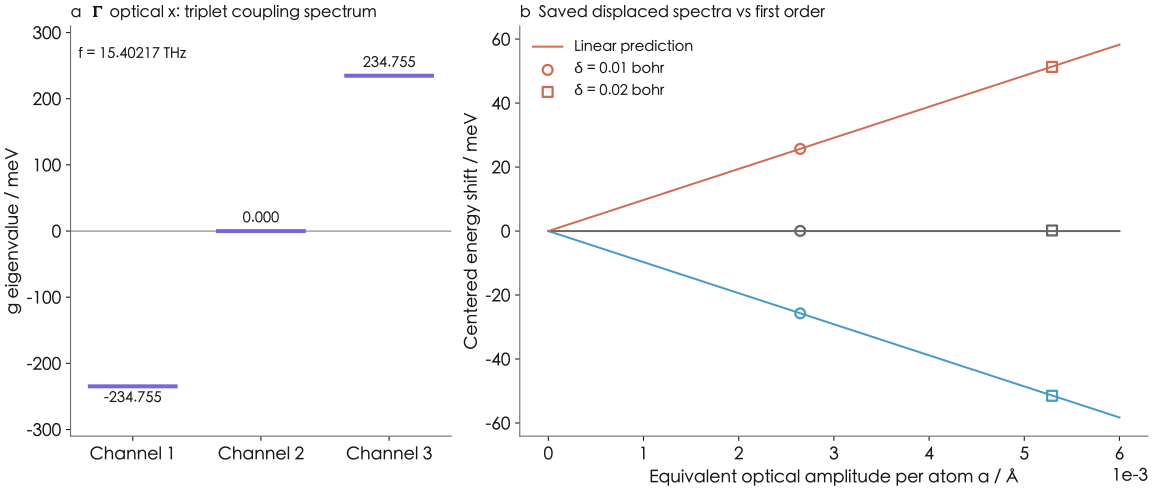
a · Γ coupling eigenchannels: plotted values
| Series | Eigenchannel | g / meV |
|---|---|---|
| Optical x | 1 | -234.755060903851 |
| Optical x | 2 | 8.055578576756846e-7 |
| Optical x | 3 | 234.75506282715537 |
b · Displaced states and first-order slopes: plotted values
| Series | Equivalent optical amplitude a / Å | Centered Δε / meV |
|---|---|---|
| Channel 1 | 0 | 0 |
| Channel 1 | 0.006 | -58.277482317877244 |
| Displaced states | 0.0026458860528192057 | -25.721885407781098 |
| Displaced states | 0.005291772105638411 | -51.48696981405938 |
| Channel 2 | 0 | 0 |
| Channel 2 | 0.006 | 1.9997815436213104e-7 |
| Displaced states | 0.0026458860528192057 | 0.04418538200166033 |
| Displaced states | 0.005291772105638411 | 0.17673580963932775 |
| Channel 3 | 0 | 0 |
| Channel 3 | 0.006 | 58.27748279533377 |
| Displaced states | 0.0026458860528192057 | 25.677700025776417 |
| Displaced states | 0.005291772105638411 | 51.31023400442005 |
The full-step relative error in total splitting width is 0.000148 %, while the centered branchwise error divided by spectral width is 0.1719 %; the half-step branchwise value is 0.08596 %. Error cancellation reduces the total-width discrepancy. The approximately halved branchwise relative error is consistent with second-order finite-amplitude level corrections. The full-/half-step -matrix relative difference is 0.00202 %. These metrics describe vertex step-size sensitivity, total spectral width and individual-branch finite-displacement errors separately.
The reference , / projections for six displaced states and complex subspace solve were obtained in a browser Worker. This fully occupied valence subspace describes level splitting under an adiabatic linear perturbation. Scattering rates would additionally require electronic occupations, phase space and broader band and wavevector sampling.
Finite wavevectors, Wannier functions and sampling accuracy
A displacement at finite connects electronic and . The supercell matrix must satisfy ; summing local atomic displacements with intercell phases produces the target response. Here force constants use , and displacements use . Folded electronic states require consistent mapping, atomic translations and Bloch phases.
General finite- USPP projection uses two-sided projector transport. In the combined supercell electronic space, projected and , reference and transport form
Centered differences of signed states yield the target electronic blocks. relates the reference states and displaced projectors on both sides; nonlocal terms, augmentation, overlap and potential gauge all enter the vertex. The Γ triplet uses a scalar reference energy, whereas this expression retains reference Hamiltonians on both sides.
A projection for a single displaced atom in a supercell is multiplied by the primitive-cell count to recover the per-cell Bloch vertex. The Wannier inverse uses the original Fourier weights, and the mass factor enters once at mode projection. Nonzero- g is generally non-Hermitian; reverse-process adjoint relations, singular values and Frobenius norms provide suitable comparisons. For degenerate phonons, summed intensity and polarization-subspace overlap describe the group jointly.
Four-valence Wannier space and k/q sampling
Four occupied valence bands form the Wannier space without SOC, initialized by four bond-centered s Gaussians with σ=1.5 bohr, using an isolated valence-band subspace [4–6]. Browser localization took 8.80 s, with total spread 30.87932 bohr² and about 2.04 GiB peak linear memory. Localization converts the electronic Hamiltonian and EPC to real-space coefficients that can be reused for queries at different electronic and phonon .
Three levels of sampling enter: 12³ for reference SCF integration, 2³ electronic and 2³ phonon for coarse EPC sampling, and query points for evaluating real-space coefficients. The 16-Si 2×2×2 supercell supplies 64 electronic-block pairs and six Cartesian-coordinate responses. The double-Fourier phase is , with . Relative coarse-mesh return differences are 6.39×10⁻⁸ for energies and 2.01×10⁻⁶ for EPC; the reverse-adjoint difference is 2.28×10⁻¹³. These test Fourier transforms and normalization. Variation outside the mesh requires independent responses.
Coarse-mesh reconstruction and off-grid errors
Figure 4 compares native direct response in a 4×1×1 supercell with browser 2³ Wannier interpolation at =(1/4,0,0), electronic . The two transverse acoustic modes fall from the directly calculated 2.79142 THz to the interpolated 2.18472 THz, a 21.73 % difference; the longitudinal acoustic mode differs by 6.42 %. Nondegenerate optical mode 4 has a 1.244 % frequency error and a 2.610 % coupling Frobenius-norm difference, but its singular-spectrum relative difference reaches 27.082 %. Matrices of similar norm can still distribute intensity differently among channels.
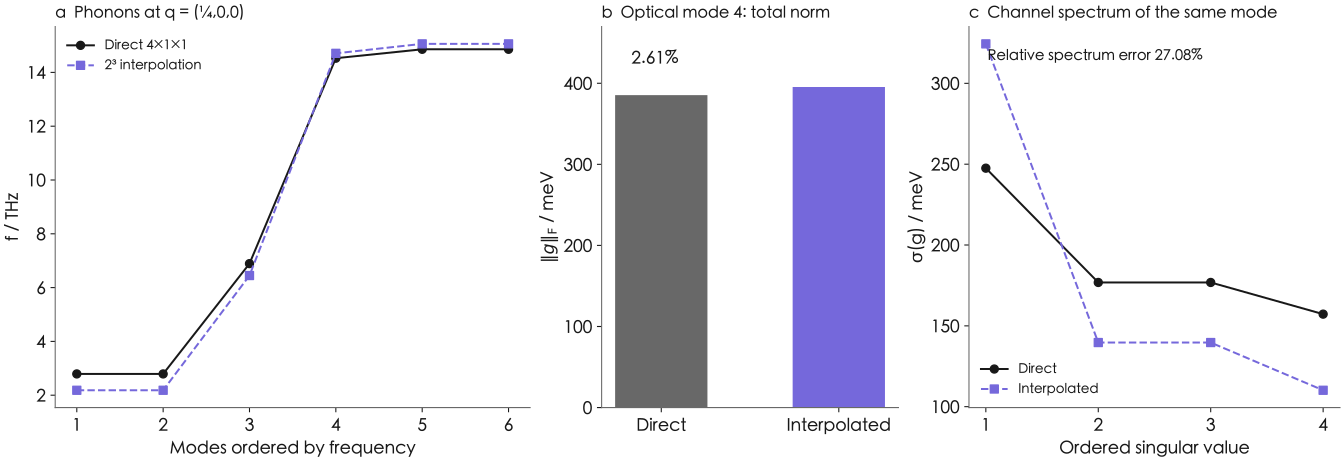
a · Phonons at q=(¼,0,0): plotted values
| Series | Mode index | f / THz |
|---|---|---|
| Direct 4×1×1 | 1 | 2.7914159487584644 |
| Direct 4×1×1 | 2 | 2.791415948758479 |
| Direct 4×1×1 | 3 | 6.891164970010469 |
| Direct 4×1×1 | 4 | 14.52713250983971 |
| Direct 4×1×1 | 5 | 14.858058461202567 |
| Direct 4×1×1 | 6 | 14.858058461202575 |
| 2³ interpolation | 1 | 2.18471838104395 |
| 2³ interpolation | 2 | 2.184718381043992 |
| 2³ interpolation | 3 | 6.448950291167558 |
| 2³ interpolation | 4 | 14.70789504909964 |
| 2³ interpolation | 5 | 15.059750602025053 |
| 2³ interpolation | 6 | 15.059750602025053 |
b · Coupling singular values of mode 4: plotted values
| Series | Singular-value index | σ(g) / meV |
|---|---|---|
| Direct calculation | 1 | 247.52665773437803 |
| Direct calculation | 2 | 176.8351619488328 |
| Direct calculation | 3 | 176.8351619488267 |
| Direct calculation | 4 | 157.2387559618053 |
| 2³ interpolation | 1 | 324.4212393856349 |
| 2³ interpolation | 2 | 139.65429207949214 |
| 2³ interpolation | 3 | 139.6542920657328 |
| 2³ interpolation | 4 | 110.15733487264572 |
The low-frequency degenerate doublet has a 25.21 % total-intensity error and a polarization-subspace overlap near 0.99995: similar polarization directions coexist with a substantial intensity shift. Four additional electronic points give a maximum valence interpolation error of 1.041 meV. Together with gauge checks and comparisons at shared , these results support inadequate coarse- sampling and motivate refinement of electronic and phonon grids separately.
Refining electronic k and phonon q separately
Additional electronic can reuse displaced potentials, while additional generally needs a new commensurate supercell. An early one-sided projection at selected agreed with native operators but differed from the Wannier vertex by 18.89 %. The subsequent six-coordinate centered vertex at =(1/2,0,0), =(1/4,0,0) used four electronic projections and Bloch rotations, generating some negative operators by symmetry. Rotations at general include Bloch phases, a central implementation challenge beyond Γ.
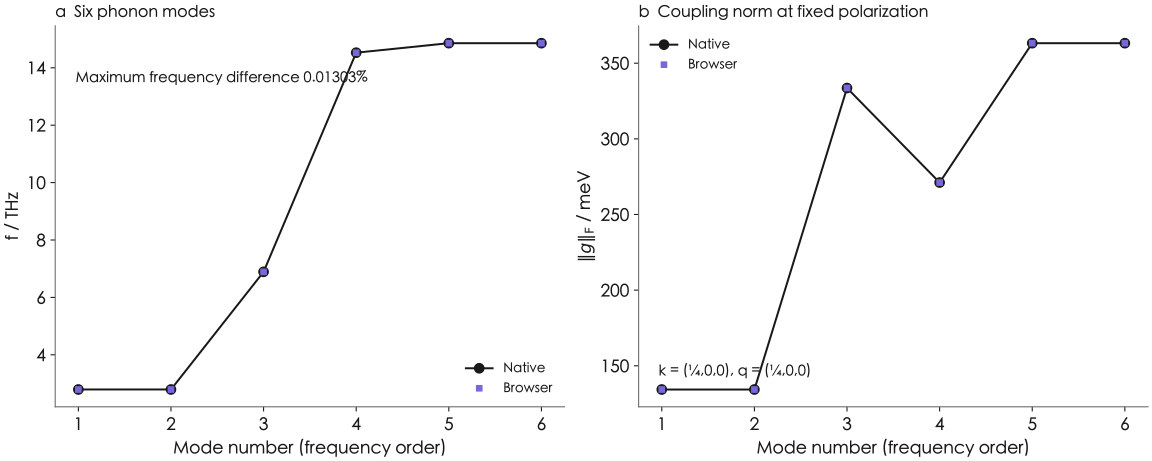
a · Six phonon modes: plotted values
| Series | Mode index | f / THz |
|---|---|---|
| Native | 1 | 2.791415948758487 |
| Native | 2 | 2.7914159487585013 |
| Native | 3 | 6.891164970010471 |
| Native | 4 | 14.527132509839717 |
| Native | 5 | 14.858058461202573 |
| Native | 6 | 14.858058461202575 |
| Browser | 1 | 2.7910523073972784 |
| Browser | 2 | 2.7910523073972926 |
| Browser | 3 | 6.890918924662095 |
| Browser | 4 | 14.526014902597714 |
| Browser | 5 | 14.85723897348477 |
| Browser | 6 | 14.857238973484774 |
b · Coupling norms at fixed polarization: plotted values
| Series | Mode index | ‖g‖F / meV |
|---|---|---|
| Native | 1 | 134.32254239288076 |
| Native | 2 | 134.3225423928331 |
| Native | 3 | 333.6007693248275 |
| Native | 4 | 271.11770870502596 |
| Native | 5 | 363.23112763613824 |
| Native | 6 | 363.2311276361356 |
| Browser | 1 | 134.31805112313393 |
| Browser | 2 | 134.3180887092938 |
| Browser | 3 | 333.6075379333048 |
| Browser | 4 | 271.12507983941714 |
| Browser | 5 | 363.23825094294926 |
| Browser | 6 | 363.2382842370824 |
The browser subsequently obtained positive and negative self-consistent states, the six-coordinate vertex and all six modes at ==(1/4,0,0) in a 4×1×1 supercell. Figure 5 compares native results using the same electronic reference and browser polarizations: the six-coordinate vertex differs by 0.003375 %, and the maximum frequency difference is 0.013027 %. This direct point tests the browser implementation at finite wavevector. Figure 4, with electronic , tests coarse-grid interpolation. The two comparisons address implementation and sampling separately.
Nondiagonal supercells reduce the number of primitive cells needed for some points [7]. A native calculation at =(0,1/4,1/2) uses an 8-Si supercell with , combining four signed x/y states with electronic mirror/inversion transport to obtain the six-coordinate response. The highest-frequency mode is 14.41078 THz, with four-valence g singular values of 269.840, 165.552, 159.913 and 122.684 meV. Its six-coordinate vertex differs from coarse-grid interpolation by 19.375 %, and mode singular spectra differ by 3.25–35.55 %, indicating that refinement must address both and .
Accuracy limits and further sampling
The dataset covers calculations completed by 14 October 2026 and covers density derivatives, Γ phonons, valence coupling spectra and direct responses at selected finite- points in fixed-cell silicon. Evidence for the nondiagonal supercell comprises native self-consistent response and Node WASM comparisons of fixed operators. Its Γ translational residuals have signed frequencies of −0.18204, +0.07005 and +0.10114 THz; the negative sign denotes an imaginary frequency associated with a negative dynamical-matrix eigenvalue. Grid-refinement diagnostics identify a contribution from quadrature error. A 4³ /4³ mesh and an independent =1/3 response define subsequent convergence studies.
The quantitative results refer to the fixed lattice, PBE/USPP model, stated cutoffs and integration grids, and four occupied valence bands. Response convergence is assessed through cutoff and integration-grid refinement, displacement-step comparisons and direct off-grid calculations. Calculations of conduction-band scattering, mobility and superconducting properties additionally require the relevant bands, occupations and full-Brillouin-zone phase-space integration.
Computational performance and memory requirements
Finite-displacement calculations require multiple self-consistent states, making complete electronic-solve time a major cost of response calculations. In the matched-machine water comparison in Figure 6a, the SIMD four-thread configuration reduces median complete-solve time from 162.04 to 97.79 s, a 39.65 % reduction.
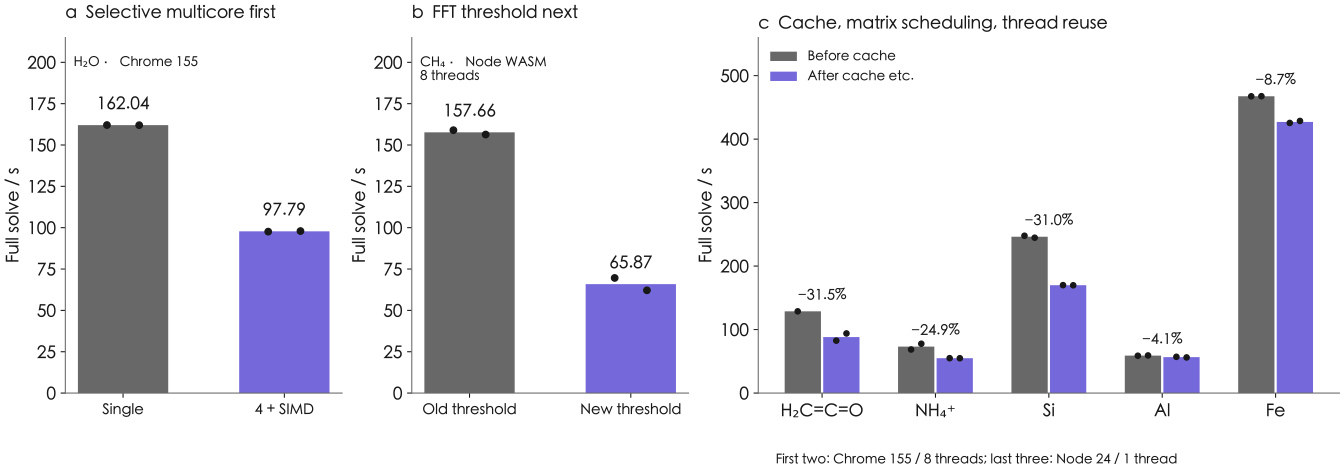
The CH₄ comparison uses a 128³ wavefunction grid, a 168³ density grid and eight-thread Node WASM, comparing two versions with identical inputs and solver settings. Mean complete-solve time decreases from 157.659 to 65.870 s, a 58.22 % reduction.
In the subsequent version comparison, browser median times decrease by 31.47 % for ketene and 24.92 % for NH₄⁺. Single-thread Node WASM reductions are 31.02 % for Si, 4.09 % for Al and 8.66 % for Fe. Each panel uses its own matched comparison; captions and Methods specify timing conditions and repetition counts.
Wasm32 and Memory64: capacity and execution cost
Parallelism reduces elapsed time, while address space determines whether a task fits in memory. Wasm32 has a 4 GiB linear address-space ceiling. Threads share numerical arrays, but projector caches, thread stacks and intermediate matrices still consume space. Response calculations also retain wavefunctions, displaced potentials and outputs, so linear-memory high-water marks and browser-process usage require separate estimates.
Memory64 expands addressing capacity at an execution cost. In matched-machine ABBA full solves, eight-thread NH₄⁺ Chrome Worker means were 53.915 s for wasm32 and 57.746 s for wasm64, a 7.10 % increase. Single-thread Al under Node took 43.774 and 51.714 s, an 18.14 % increase. These limited samples support retaining wasm32 for small supercells while evaluating capacity and speed separately for larger tasks. FFT compiler and local-index changes showed no reliable full-task improvement; the microbenchmarks are reported in the methods.
Methods, data and provenance
Primitive-cell lattice vectors are (0,5.13,5.13), (5.13,0,5.13) and (5.13,5.13,0) bohr, with atoms at (0,0,0) and (2.565,2.565,2.565) bohr. Calculations use PBE/GBRV Si USPP, 20/100 Ha, Γ-centered 12³ reference integration and mass 28.085 u, without SOC or spin polarization. Full/half steps are ±0.02/±0.01 bohr, with both final SCF residuals below 10⁻⁹. Raw force constants and ASR corrections are retained separately; the uniform-translation relative residual is 1.73×10⁻⁹.
Performance measurements use an Apple M1 Pro with 32 GiB. Water uses Chrome 155 ABBA with combined SIMD and selective four-thread execution. CH₄ uses an interleaved eight-thread Node WASM comparison including initialization, SCF, forces and output: two runs per arm, one optimized run with 36 cycles and the others with 37. Browser projector-cache comparisons use Chrome 155 with eight threads; periodic samples use single-thread Node WASM. Ketene has one successful pre-optimization and two post-optimization runs, with another old run stalled; other cases have two per arm. Baselines are independent, and the single-thread water build differs from the website release.
In FFT microbenchmarks, median 128³ complex forward/inverse transform times are 58.759 ms with one thread and 14.740 ms with eight threads; 168³ real-transform times are 67.134 and 15.108 ms. The measurement covers transform execution. Complete tasks and microbenchmarks separately identify initialization, numerical operations and output boundaries.
Browser/native errors compare each quantity using the same method and reference states. Relative Wannier differences in , U and HePh are 1.51×10⁻¹¹, 1.00×10⁻¹¹ and 5.25×10⁻¹³; browser/NumPy eigenvalues of the same Γ matrix differ by 1.82×10⁻¹² meV. The positive and negative 4×1×1 browser states took 1168.763/1349.367 s, with 1.622 GiB peak linear memory each. The table distinguishes implementation, step-size and interpolation differences by physical quantity.
| Comparison | Quantity | Result | Meaning |
|---|---|---|---|
| Bandlimited states: browser/native | Energy / force / density | 1.190 × 10⁻¹³ Ha; 7.951 × 10⁻¹¹ Ha bohr⁻¹; 1.854 × 10⁻⁹ | Same-method implementation agreement |
| Γ force/density half step | Relative difference | 0.01049 % / 0.11281 % | Finite-difference stability |
| Γ full-step splitting | Width / centered branches | 0.000148 % / 0.1719 % | Different spectral metrics |
| Γ G full/half step | Matrix relative difference | 0.002022 % | Step-size check |
| Γ complex-spectrum postprocessing | Browser/NumPy eigenvalues | 1.82×10⁻¹² meV | Diagonalization of one matrix |
| Wannier mesh return | Electronic / EPC | 6.39×10⁻⁸ / 2.01×10⁻⁶ | Transform and normalization |
| 2³ off-grid mode 4 | Frequency / norm / spectrum | 1.244 % / 2.610 % / 27.082 % | Measured interpolation error |
| Browser k=q=1/4 | Six coordinates / maximum frequency | 0.003375 % / 0.013027 % | Cross-implementation direct-point comparison |
Data and reproducibility
raw-results.json.gzip provides the plotted response quantities and their provenance; summary.csv contains complete-solve timings. Figures and interactive curves use the same numerical data, supporting reproduction of curves, differences and statistics.
Calculation reproduction uses the structures, pseudopotentials, cutoffs, meshes, displacements and reference electronic spaces in Methods, with comparisons based on the original error definitions. Performance reproduction also records the device, thread count, initialization boundary and repetition count.
Data and sources
- R. Sundararaman et al. JDFTx: Software for joint density-functional theory. SoftwareX 6, 278–284 (2017). doi:10.1016/j.softx.2017.10.006
- D. Vanderbilt. Soft self-consistent pseudopotentials in a generalized eigenvalue formalism. Physical Review B 41, 7892–7895 (1990). doi:10.1103/PhysRevB.41.7892
- F. Giustino. Electron-phonon interactions from first principles. Reviews of Modern Physics 89, 015003 (2017). doi:10.1103/RevModPhys.89.015003
- N. Marzari et al. Maximally localized Wannier functions: Theory and applications. Reviews of Modern Physics 84, 1419–1475 (2012). doi:10.1103/RevModPhys.84.1419
- JDFTx phonon: finite displacement, saveHsub and supercell conventions.
- JDFTx wannier: phonon-supercell and mlwfHePh output.
- J. H. Lloyd-Williams, B. Monserrat. Lattice dynamics and electron-phonon coupling calculations using nondiagonal supercells. Physical Review B 92, 184301 (2015). doi:10.1103/PhysRevB.92.184301
- K. F. Garrity et al. Pseudopotentials for high-throughput DFT calculations. Computational Materials Science 81, 446–452 (2014). doi:10.1016/j.commatsci.2013.08.053
- Mol2Mat: performance benchmark configurations and software versions.
- Mol2Mat: numerical data provenance and source-file checksums.
- Mol2Mat: saved-data Mol* figure sources, render settings and checksums.